Tasks that fail only sometimes and only in certain environments are called "flaky tasks". They are enourmously time consuming to identify and debug. Nx Cloud can reliably detect flaky tasks and automatically schedule them to be re-run on a different agent.
Ideally as a developer you don't even notice flaky tasks any more as they're automatically re-run and solved for you.
Enable Flaky Task Detection
Section titled “Enable Flaky Task Detection”Flaky Task Detection is enabled by default if your workspace is connected to Nx Cloud and leverages Nx Agents.
To connect your workspace to Nx Cloud run:
npx nx@latest connectSee the connect to Nx Cloud recipe for all the details.
How Nx Identifies Flaky Tasks
Section titled “How Nx Identifies Flaky Tasks”Nx leverages its cache mechanism to identify flaky tasks.
- Nx creates a hash of all the inputs for a task whenever it is run.
- If Nx ever encounters a task that fails with a particular set of inputs and then succeeds with those same inputs, Nx knows for a fact that the task is flaky.
Nx can't know with certainty when the task has been fixed to no longer be flaky, so if a particular task has no flakiness incidents for 2 weeks, the flaky flag is removed for that task.
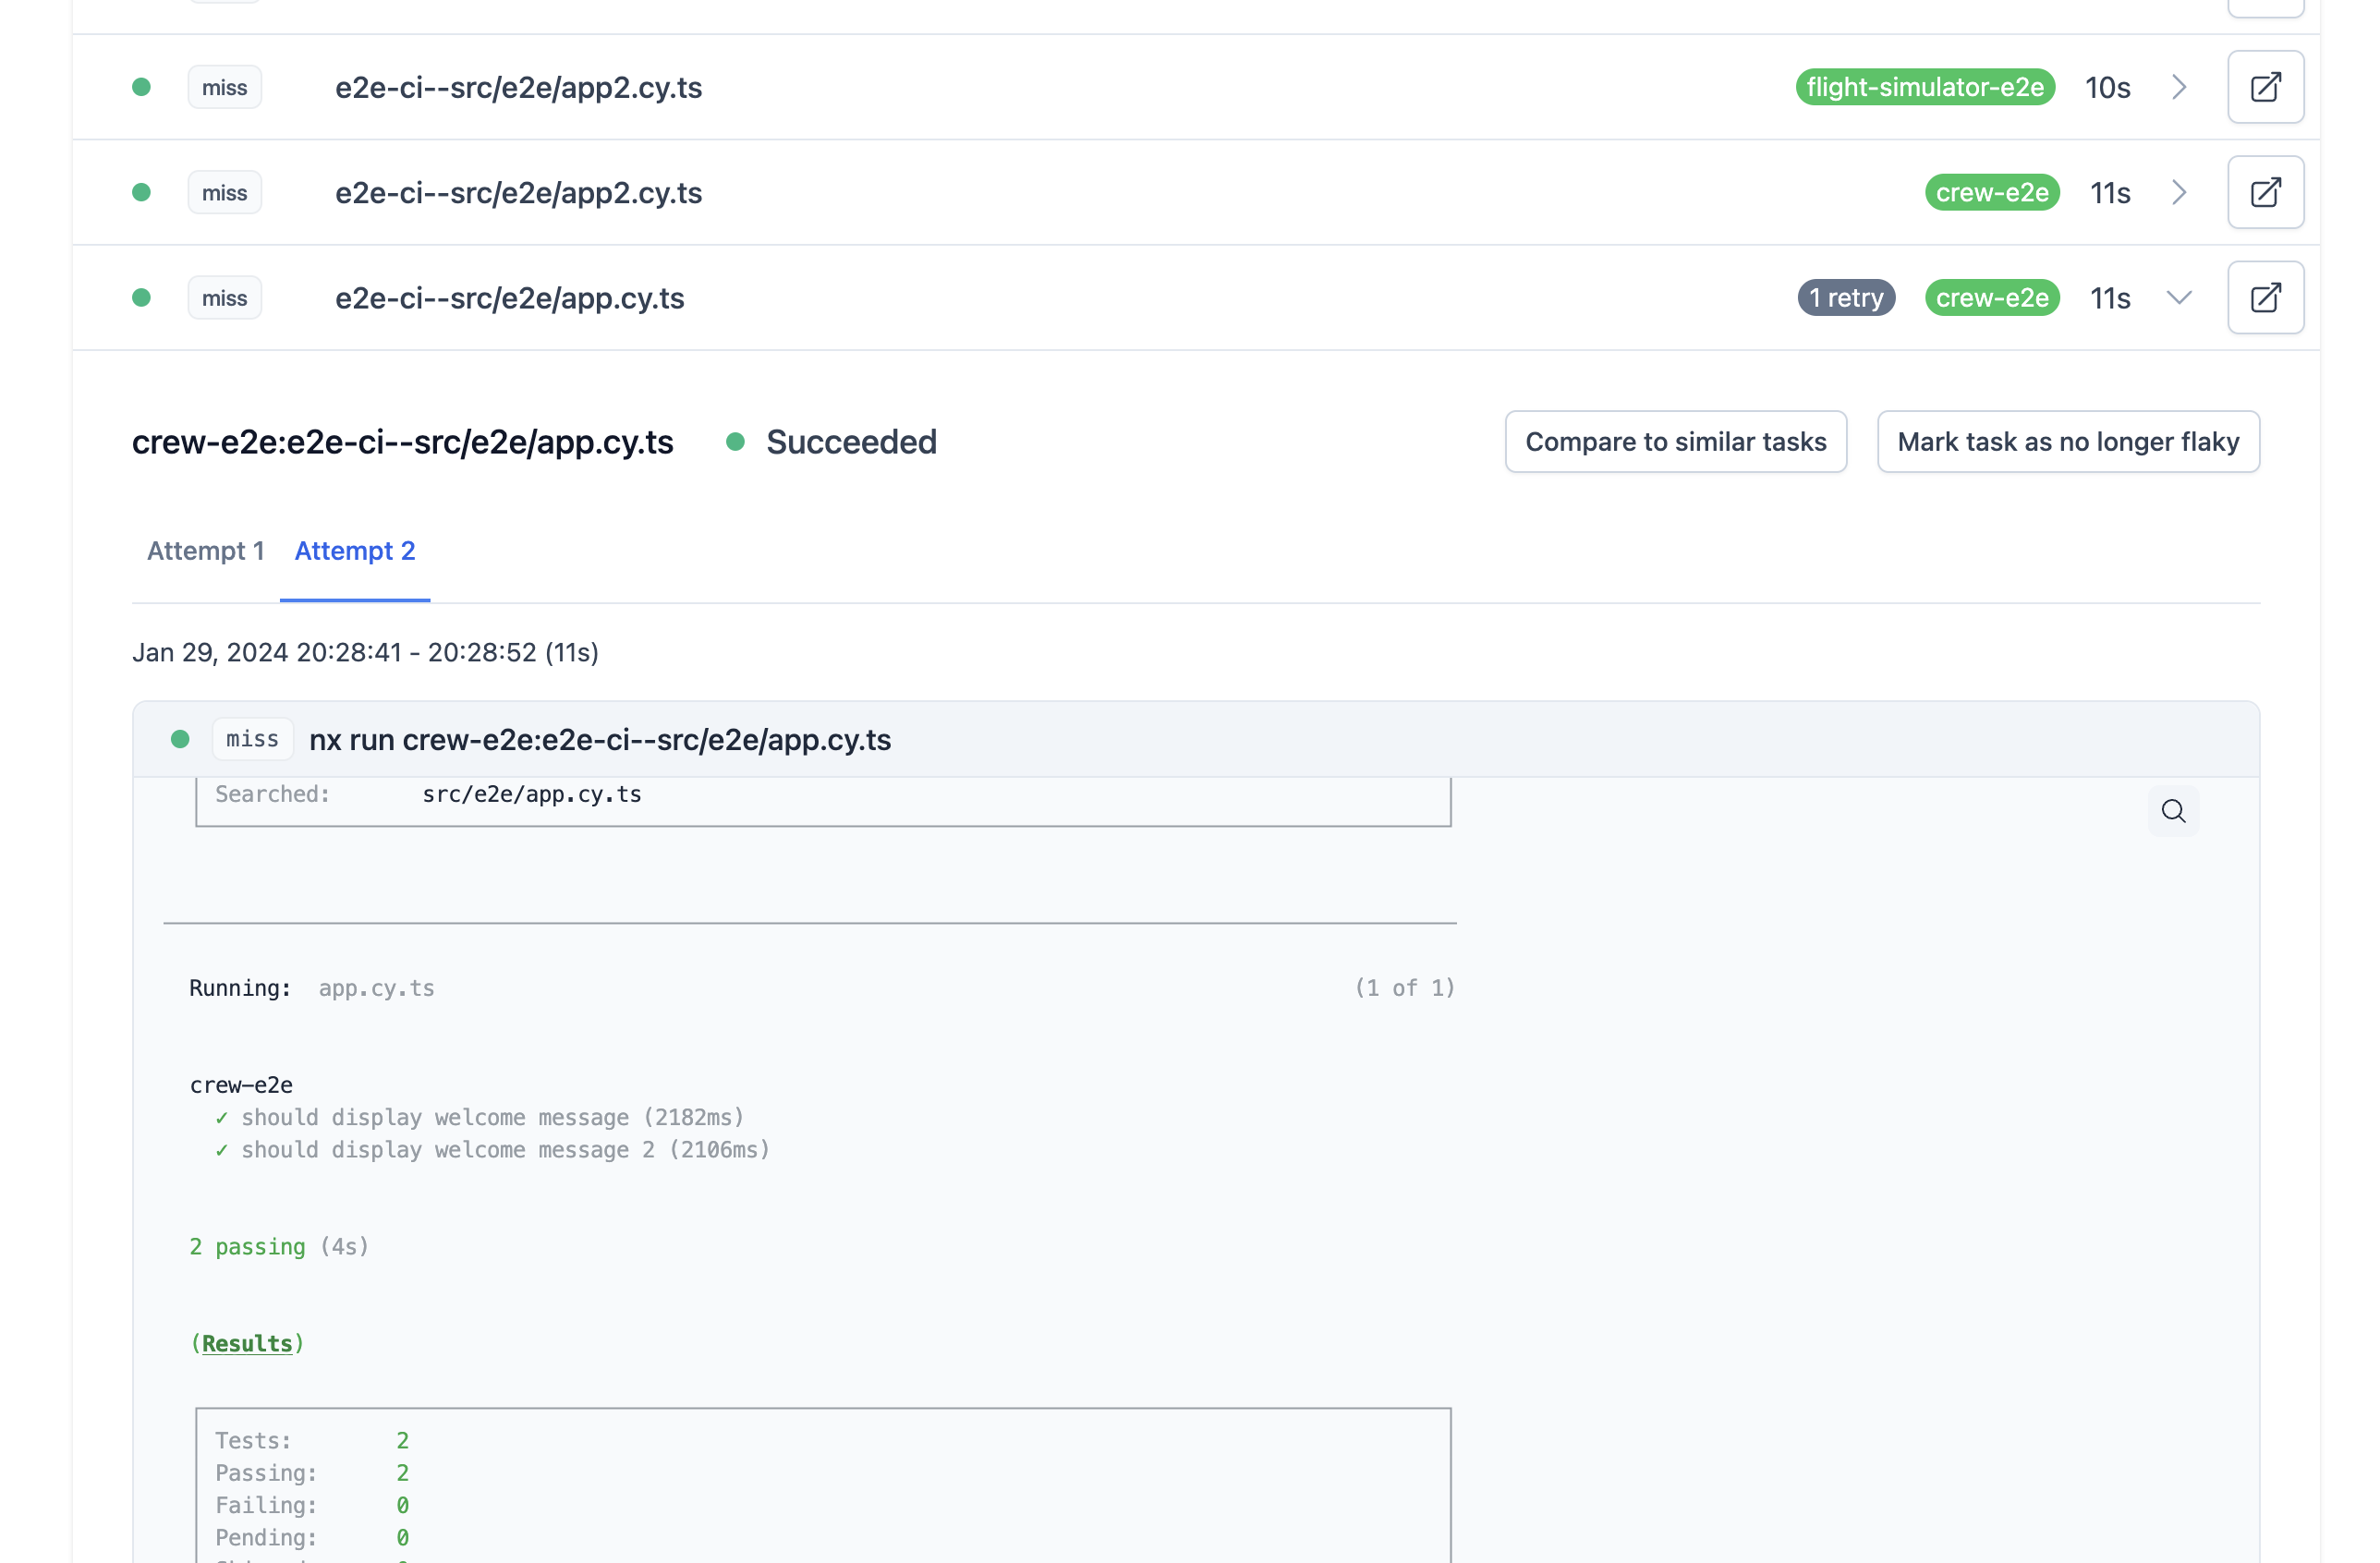
In this image, the e2e-ci--src/e2e/app.cy.ts task is a flaky task that has been automatically retried once. There is a 1 retry indicator to show that it has been retried and, once expanded, you can see tabs that contain the logs for Attempt 1 and Attempt 2. With this UI, you can easily compare the output between a successful and unsuccessful run of a flaky task.
Automatically Re-run Flaky Tasks
Section titled “Automatically Re-run Flaky Tasks”When a flaky task fails in CI with distributed task execution enabled, Nx will automatically send that task to a different agent and run it again (up to 2 tries in total). Its important to run the task on a different agent to ensure that the agent itself or the other tasks that were run on that agent are not the reason for the flakiness.
Flaky Task Analytics
Section titled “Flaky Task Analytics”Nx Cloud provides analytics to help you understand and manage flaky tasks across your workspace. The analytics dashboard gives you insights into which tasks are flaky, how often they fail, and how much time is being wasted on reruns.

The dashboard displays key metrics over the time range selected (7 days vs 30 days) to give you a quick overview of your workspace health.
- Active flaky tasks - The total number of tasks in your workspace that have a flake rate greater than 0 within the selected time window.
- Average flake rate - A weighted average flake rate across all tasks in your workspace. This metric uses the sample size to weight each task's flake rate proportionally, so a task that ran 1000 times with 5% flake rate has more impact than one that ran 10 times with 50% flake rate.
- High risk tasks - The number of tasks with a flake rate higher than 20%, indicating severe reliability issues that need immediate attention.
The chart shown provides a visual representation of your flaky tasks, helping you quickly identify which tasks need the most attention.
Tasks are plotted based on their impact score, which is calculated as flake_rate × sample_size. This means frequently-run flaky tasks are weighted higher than rarely-run flaky tasks.
Priority levels are determined using percentile-based thresholds that scale across organizations of any size:
- High priority (red) - Top 10% of tasks by impact score (90th percentile and above). These tasks have severe flakiness and should be addressed immediately.
- Medium priority (yellow) - Next 23% of tasks by impact score (67th-90th percentile). These tasks have moderate flakiness with sufficient data.
- Low priority (gray) - Bottom 67% of tasks by impact score. These tasks have minor flakiness or not enough data to be concerning.
Tasks on the right side of the chart typically represent the highest priority items that need attention. The scatter plot shows up to 50 results, sorted by most recent flaked tasks.
Flaky Task Table
Section titled “Flaky Task Table”The table provides detailed information about each flaky task in your workspace:
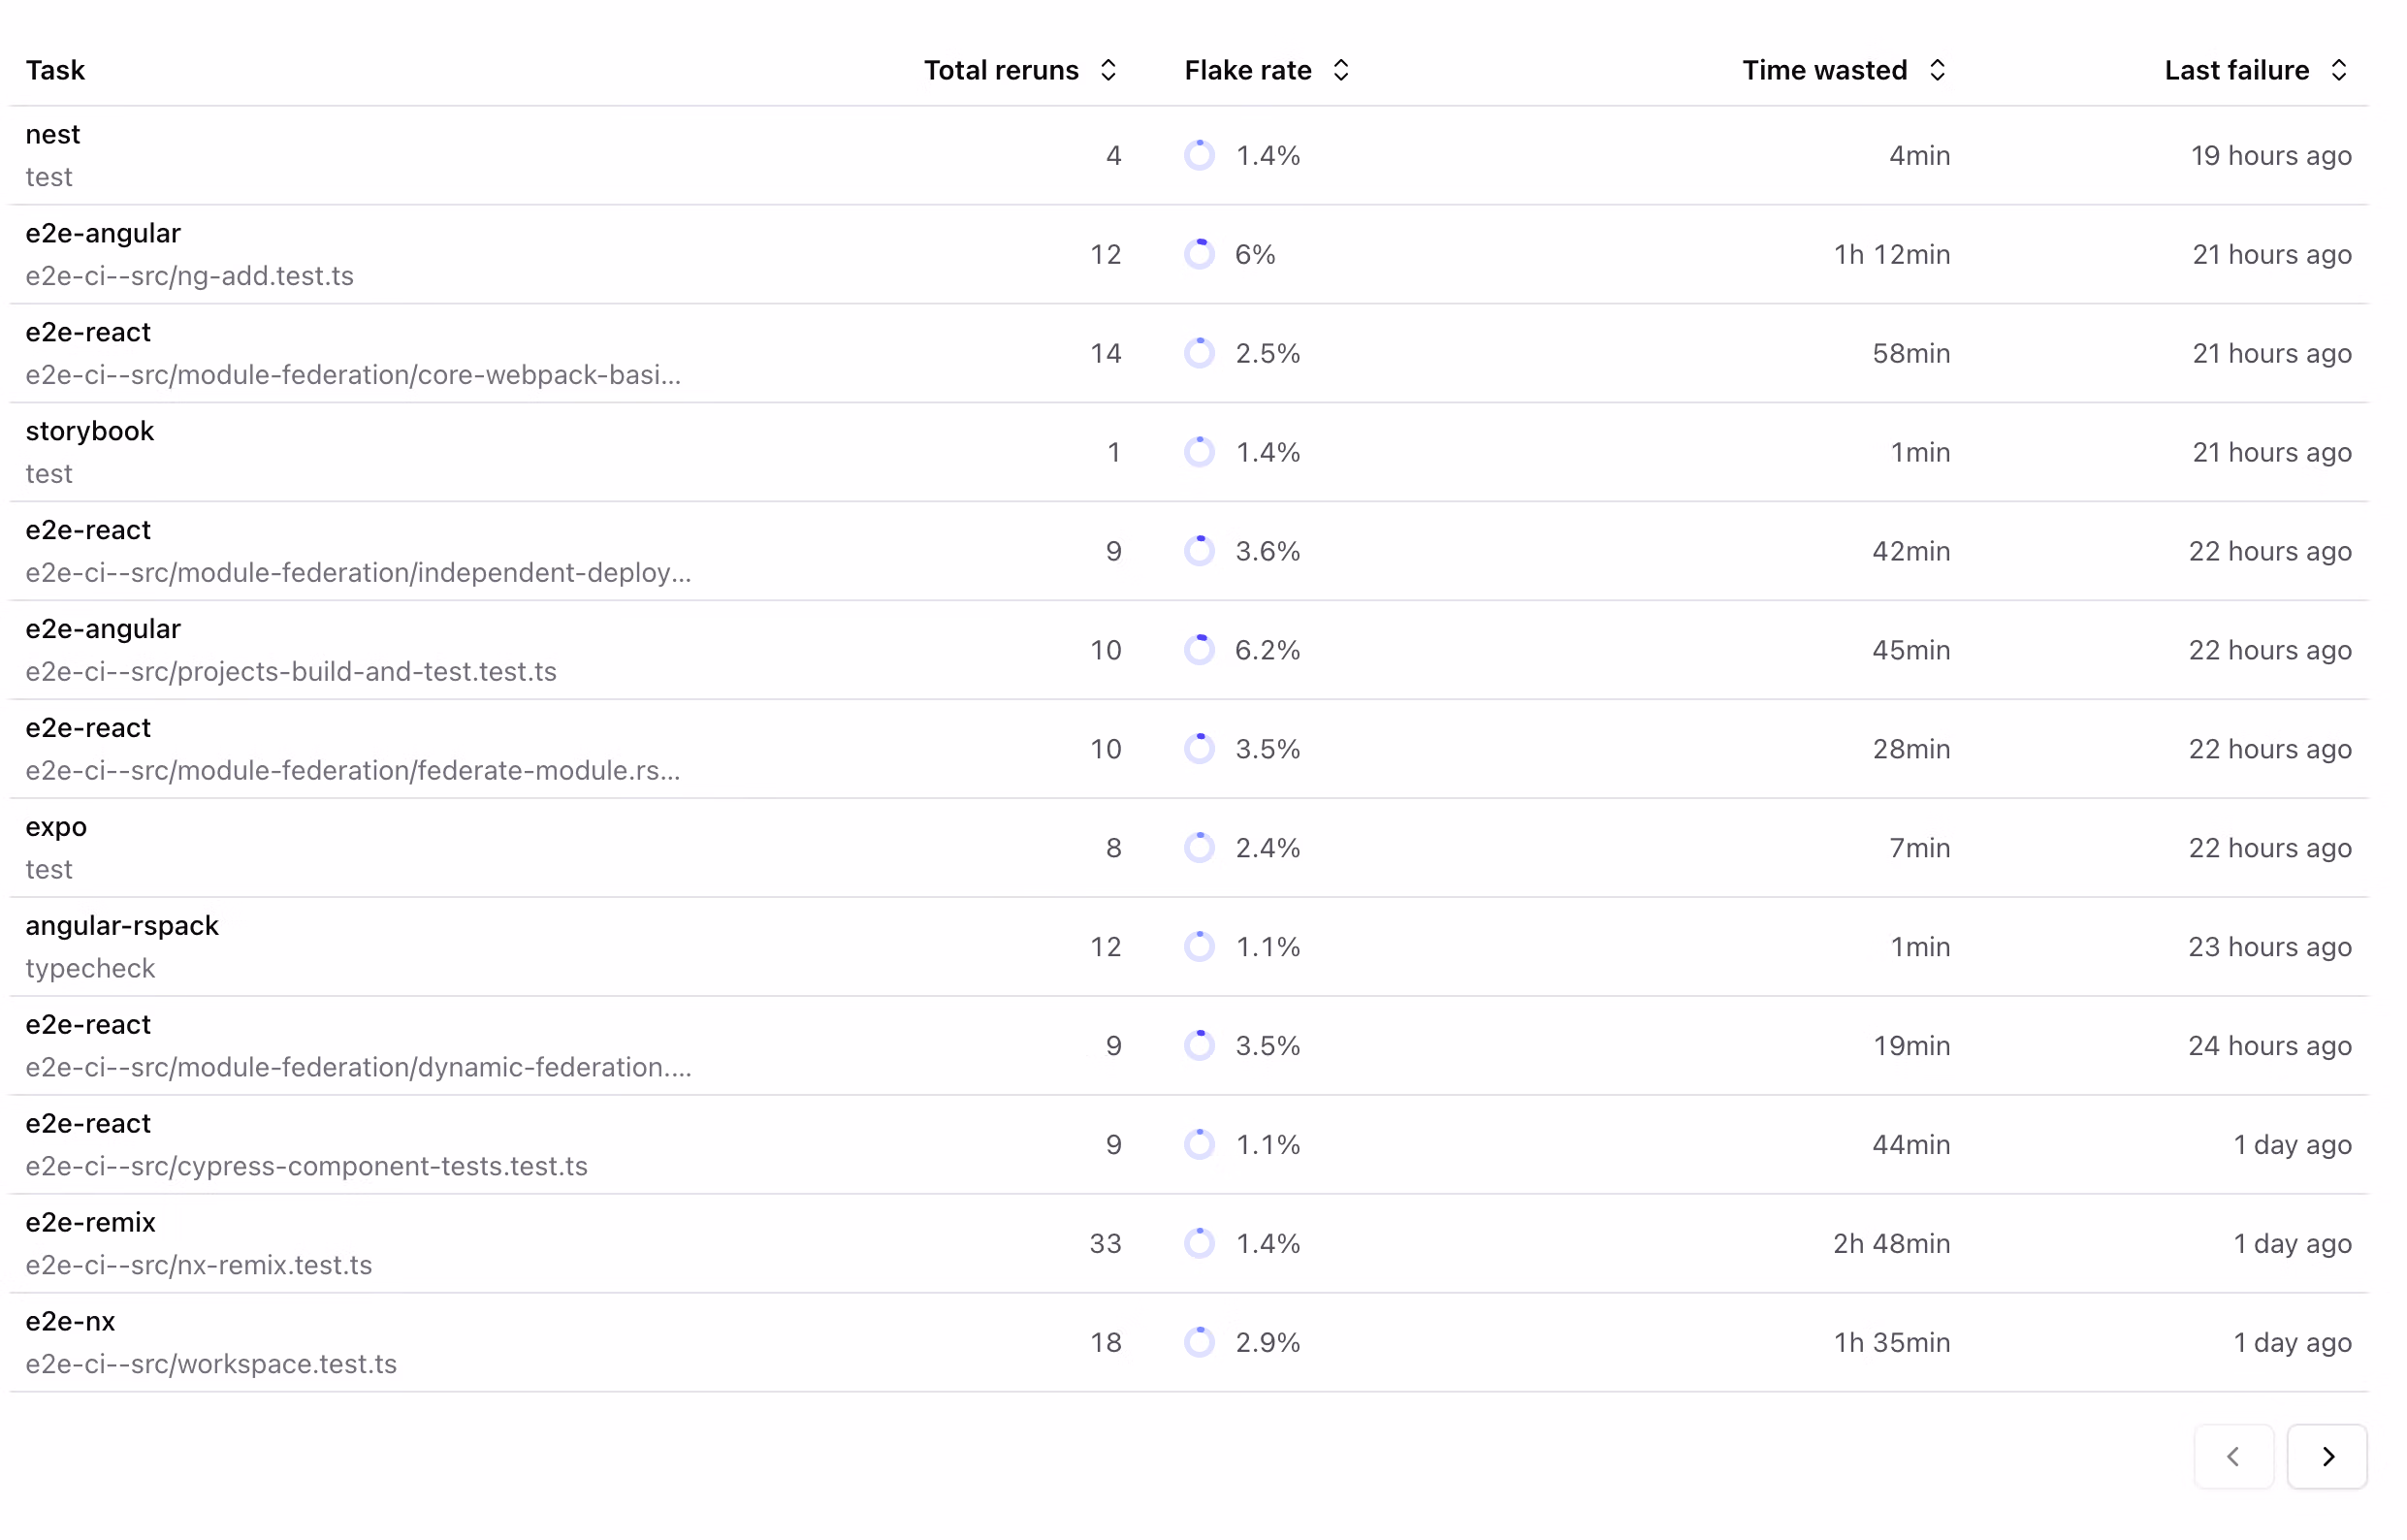
By default, the table loads your most recent flaky tasks. Each row includes:
- Task - The project and target combination (e.g.,
my-app:test) - Flake rate - Measures how often a task succeeds due to flakiness. Specifically, it represents the percentage of total successes that came from unreliable (flaky) task hashes:
flaky_successes / (flaky_successes + non_flaky_successes). This tells you: "Of all the times this task succeeded, how many successes came from unreliable code?" - Total reruns - The number of times a task was executed more than once due to flakiness. This counts the "extra" executions that happened because the task failed and needed to be retried. Calculated as:
total_executions - unique_hash_count - Time wasted - An estimate of the total time spent on reruns, calculated by multiplying the total reruns by the average task duration
- Last failure - The timestamp of the most recent failure across all contributing task hashes
Flaky Task Detail View
Section titled “Flaky Task Detail View”Click on any row in the table to view detailed information about a specific flaky task.
The Overview tab shows summary statistics and trends for the selected task such as flake rate, time wasted and automatic deflake counts

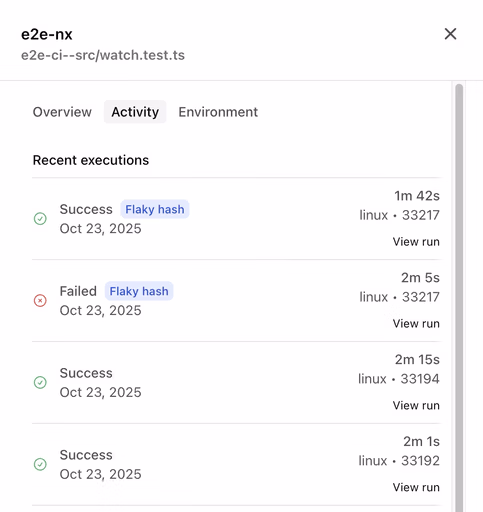
The Activity tab displays a timeline of all executions, showing when the task failed and succeeded to jump directly into the runs.
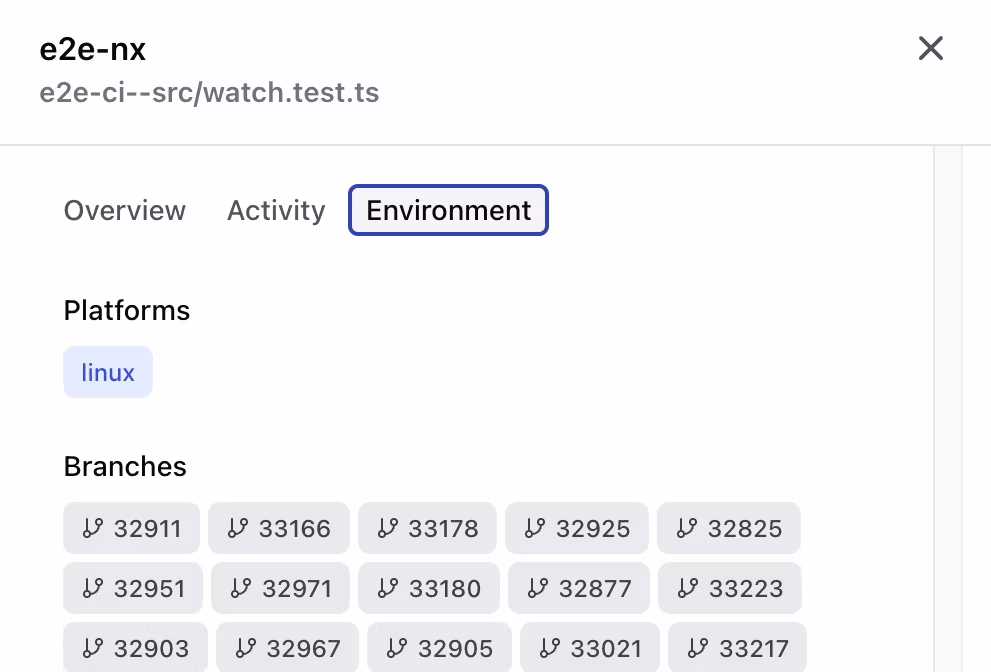
The Environments tab provides insights into the different environments where the task was executed, helping identify if certain environments contribute to flakiness.